Resume of the Future
The full article can be found on design mind as part of the FUTURE OF WORK series.
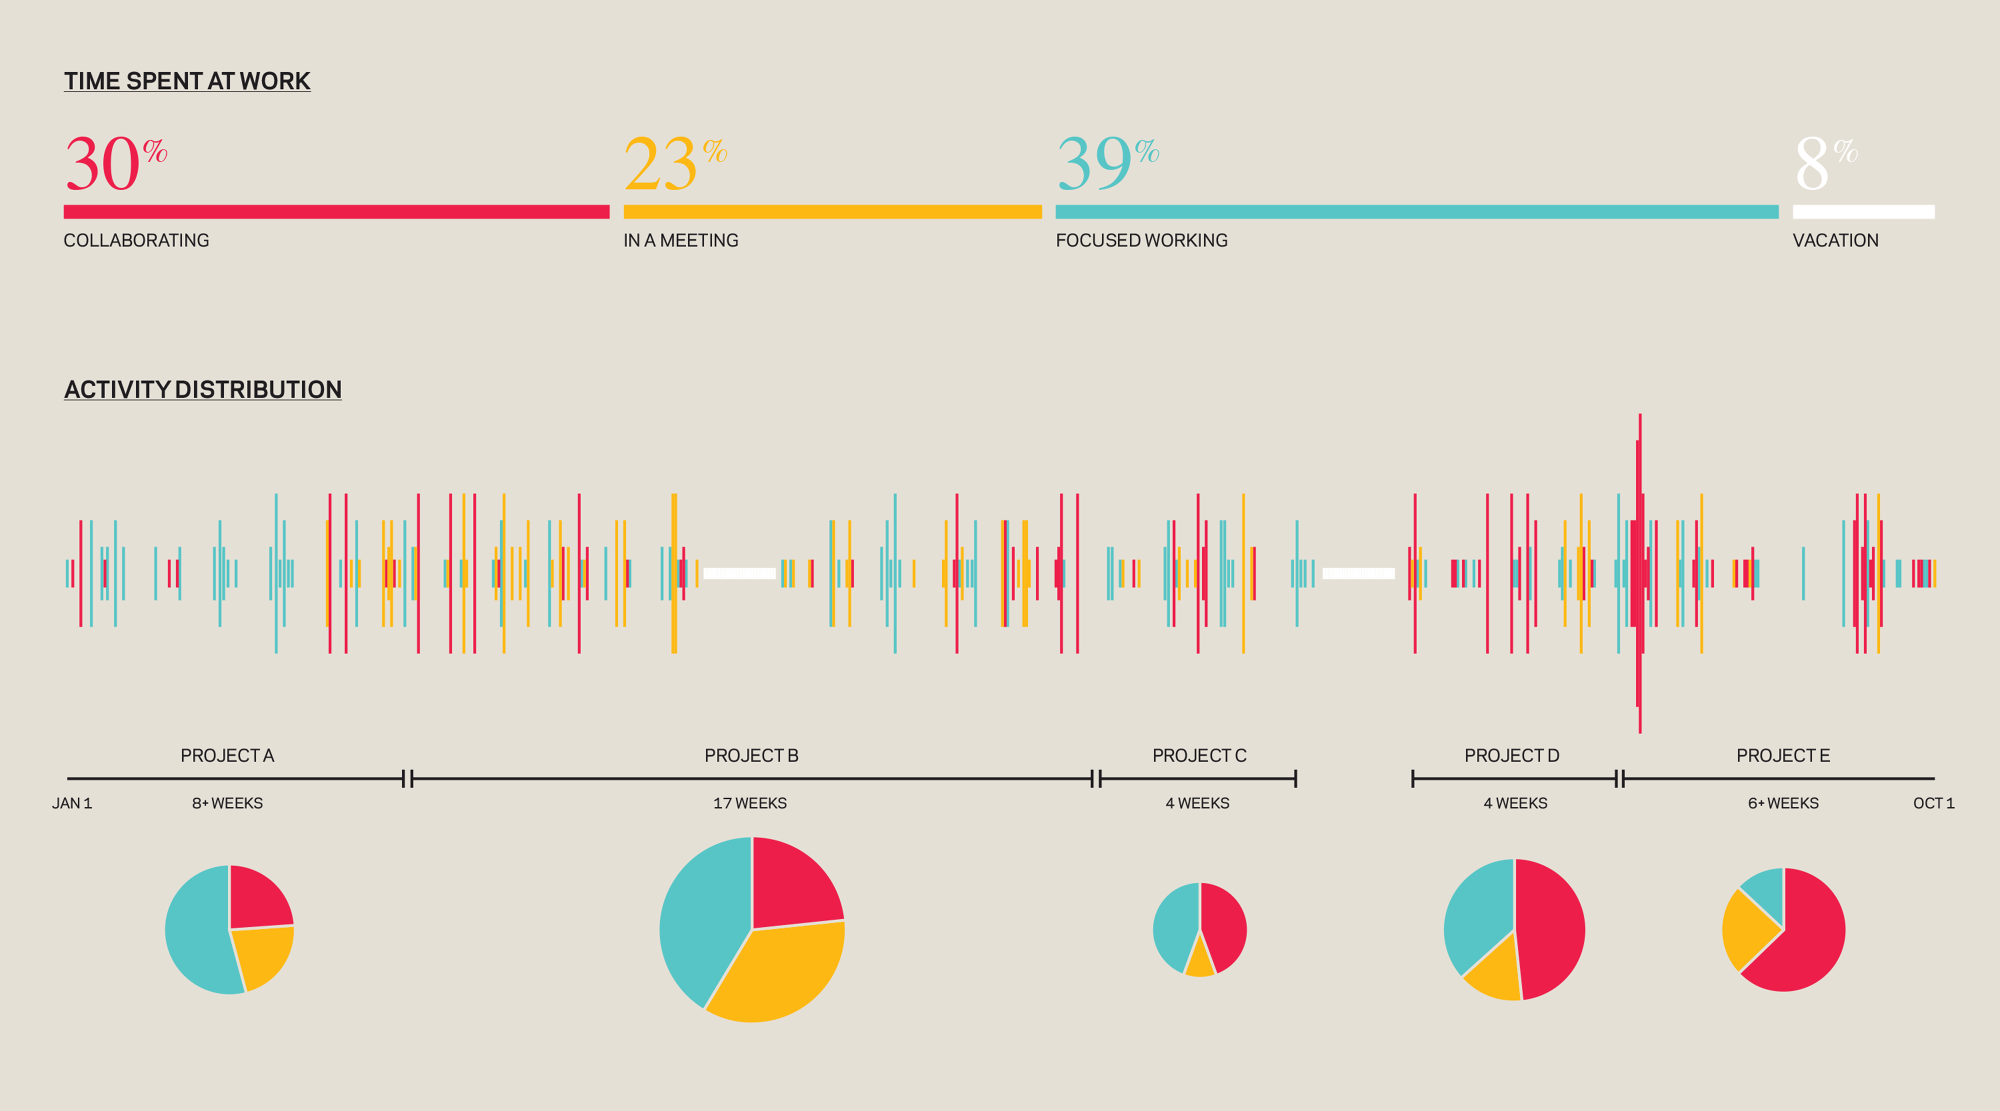
Throughout 2014, I used a mobile application called Reporter to collect information about my daily activity and interactions. Reporter sends surveys at random times throughout the day, and the survey questions are fully customizable. The questions I asked myself were: where are you, what are you doing, and who are you with? This data now provides insights into how I collaborated and worked in teams over a 10-month period.
The first chart shows how I spent my time at work—whether I was working with others or working on my own. That activity is then shown distributed over time. Including the beginning and end dates of each project across that timeline reveals how much my activity changed from project to project.
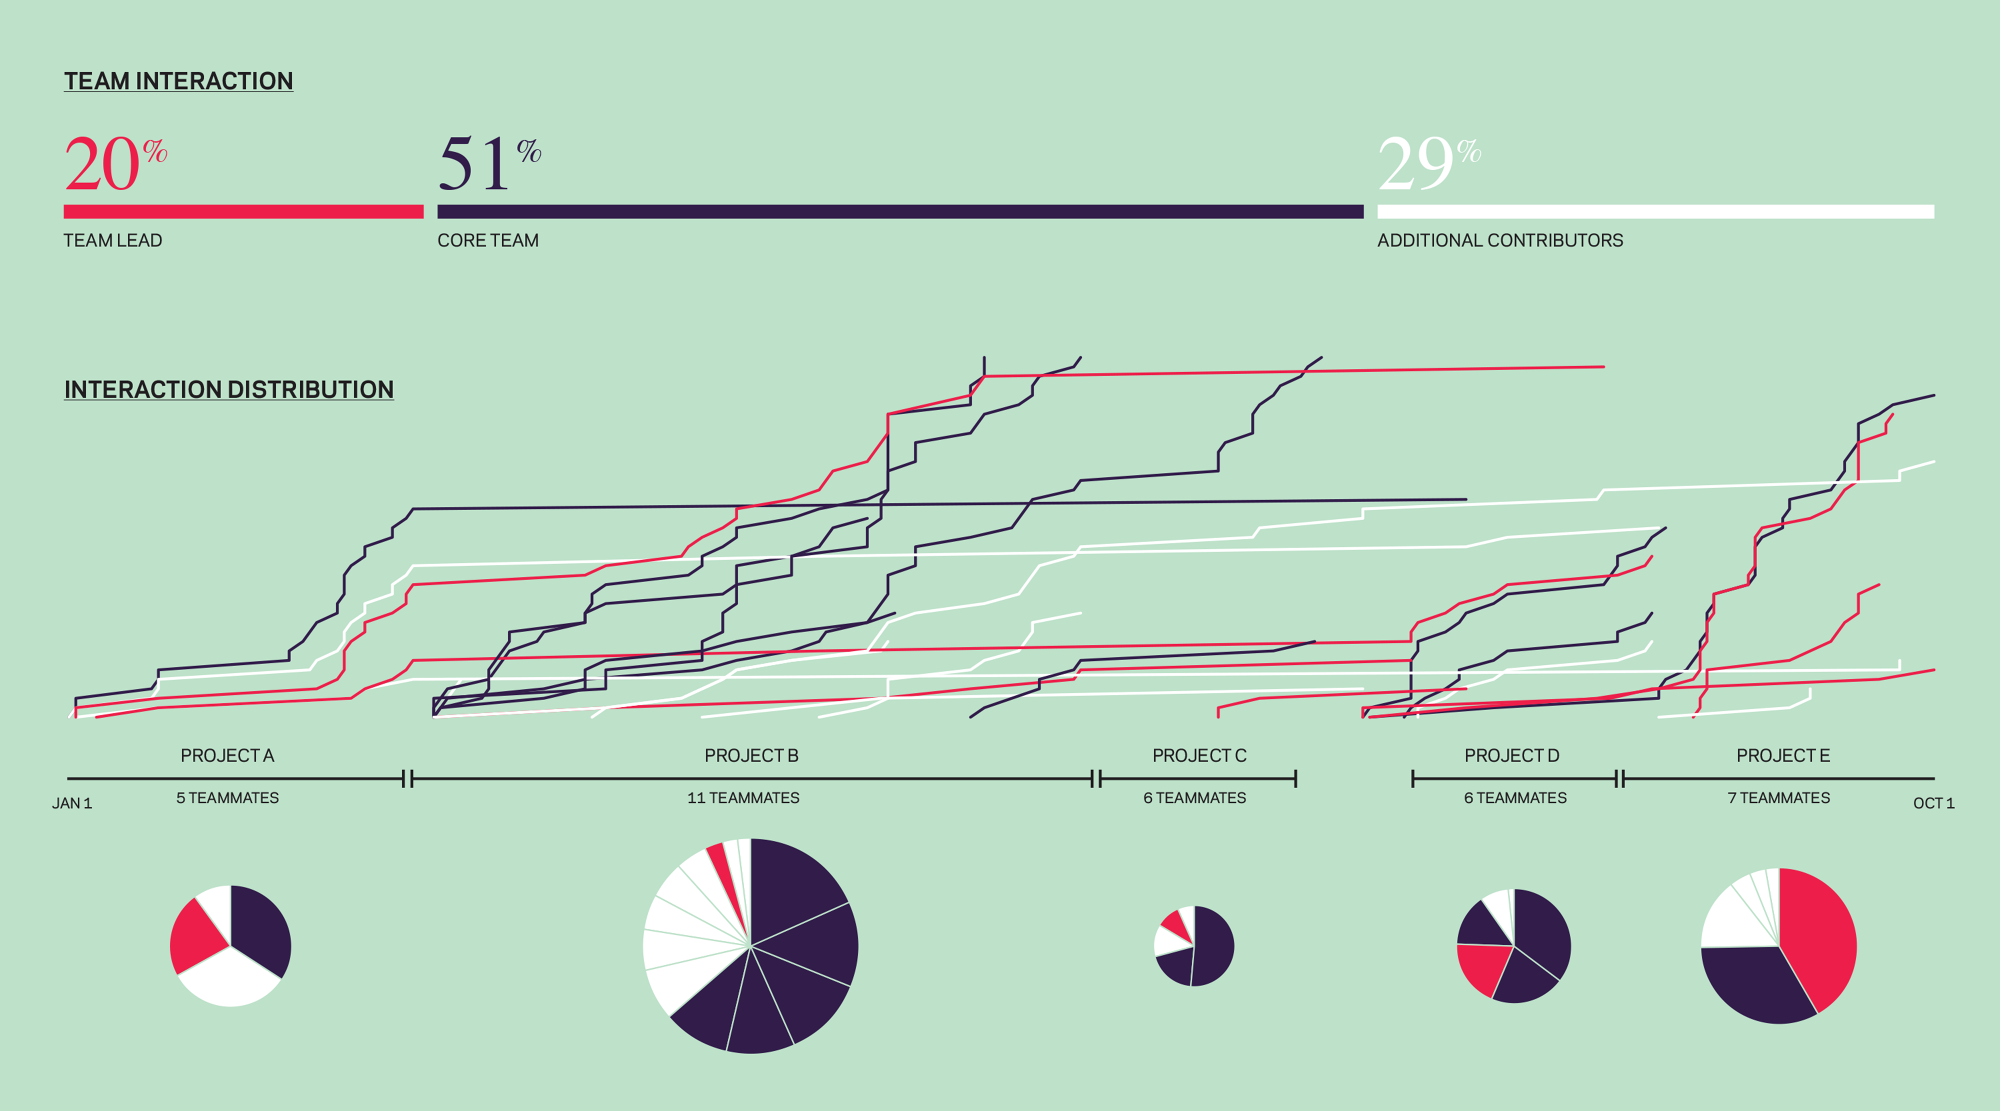
The second chart shows the role of the team members I interacted with while at work. Those interactions are then plotted over time, showing the sum and frequency of my interactions with each coworker. Including the project team composition in the pie charts reveals how the team makeup affected my individual interactions.
Visualizing this data allowed me to uncover several interesting insights. First, there are clearly different rhythms of activity and interaction among the projects. Second, smaller teams and shorter projects were heavier in collaboration, whereas the big teams and longer projects relied more on scheduled meetings. These two insights indicate that working in teams required flexibility and continual adaptation. Third, the level of team-led involvement varied slightly from project to project, but the core team involvement was consistent. Regardless of who was in charge, the team had to collaborate to move the project along.