2014: An Interactive Year In New Music
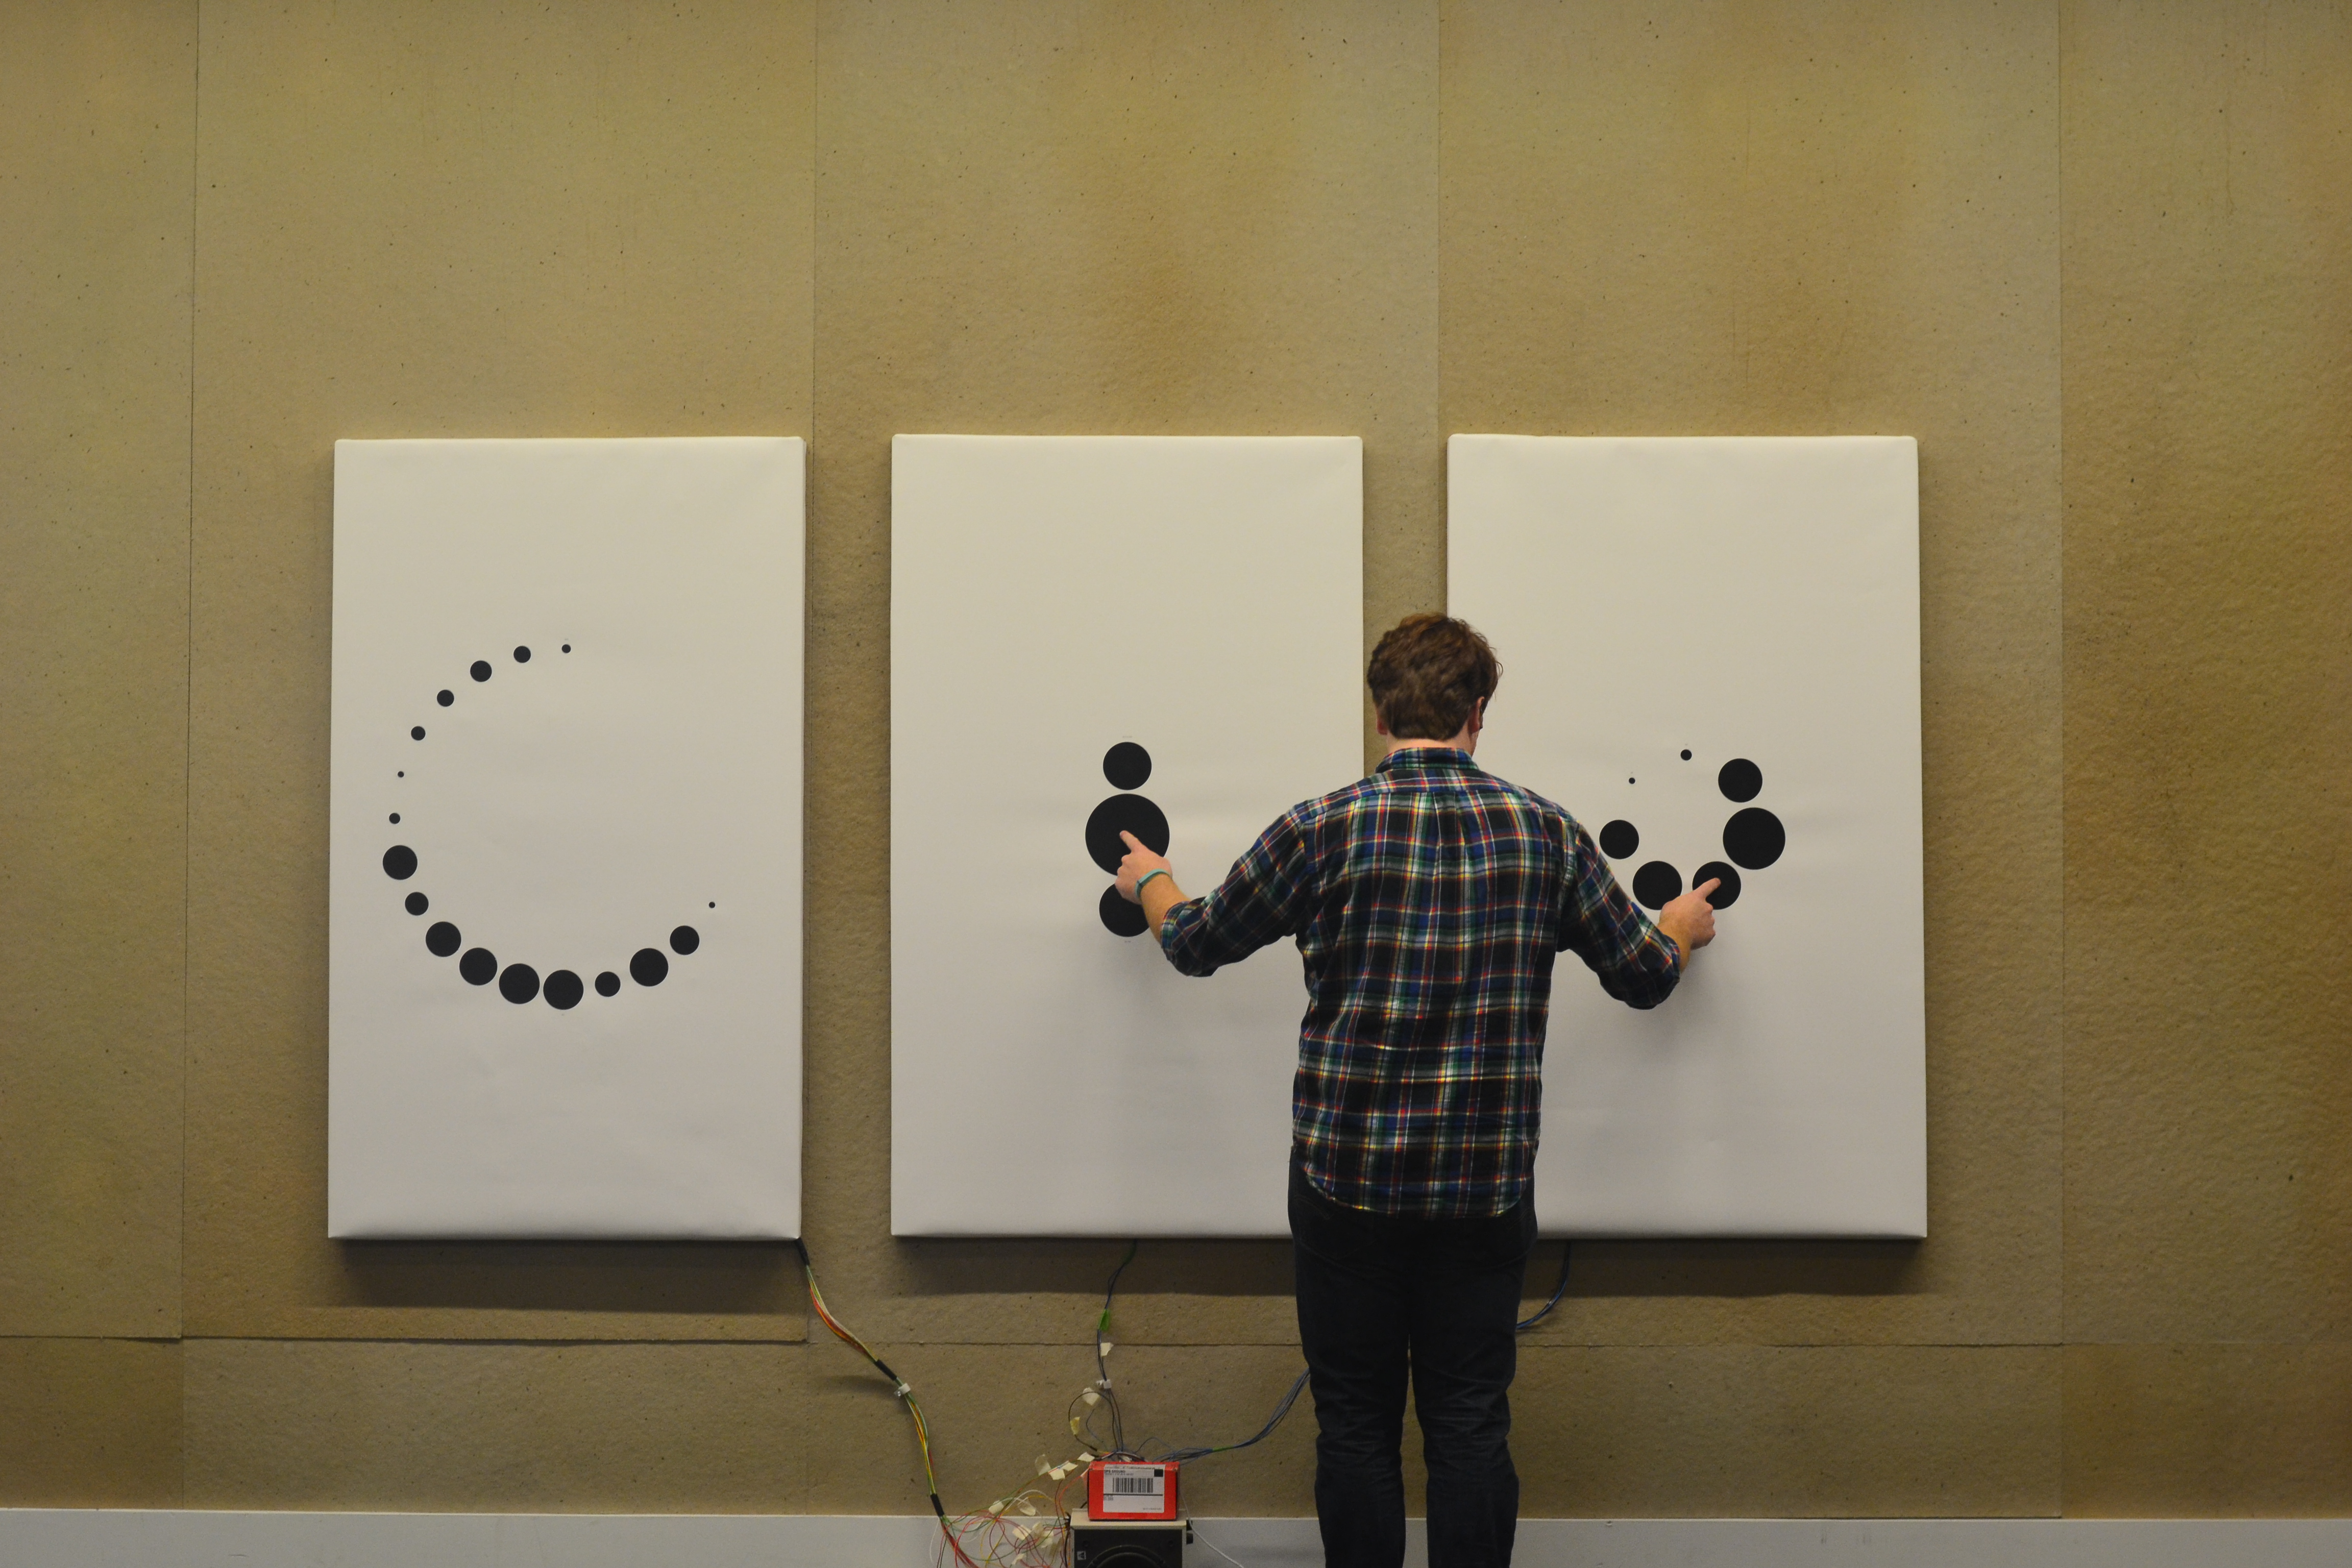
This year, in addition to a printed report, I collaborated with a friend and colleague to make an interactive component. I’ve had an ongoing interest in experiencing data using different senses beyond vision. This was a chance to put some of that to the test.
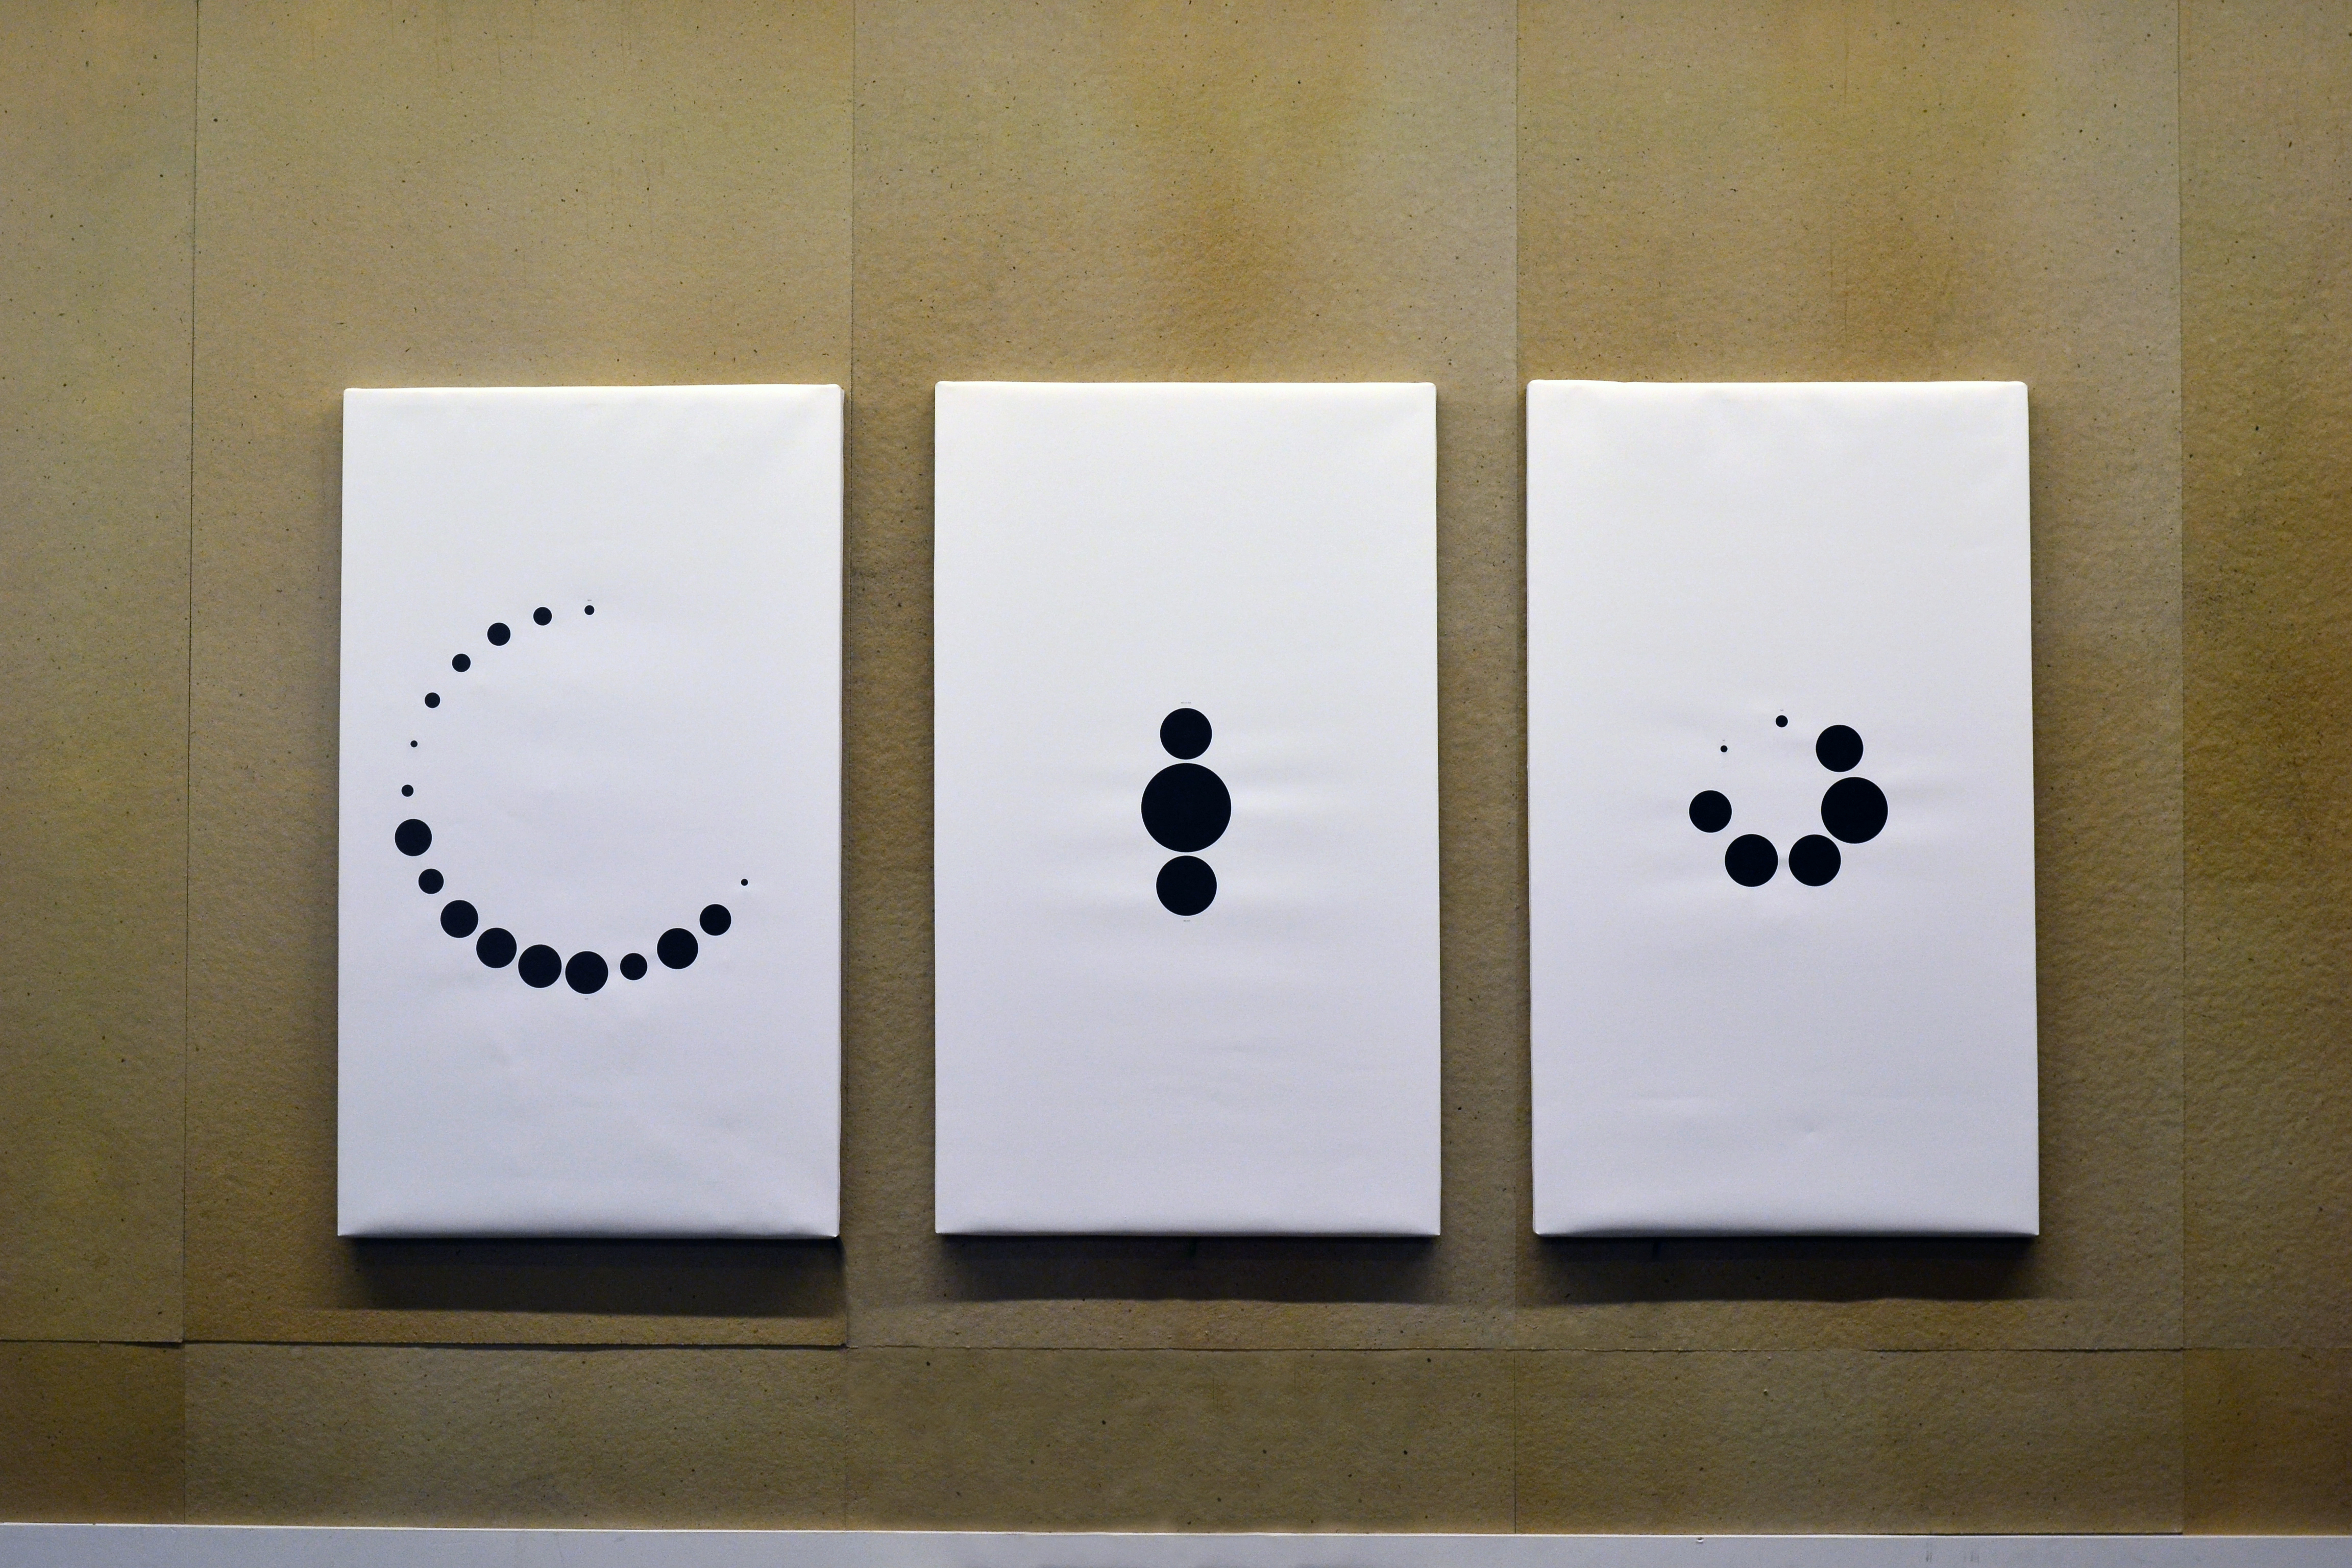
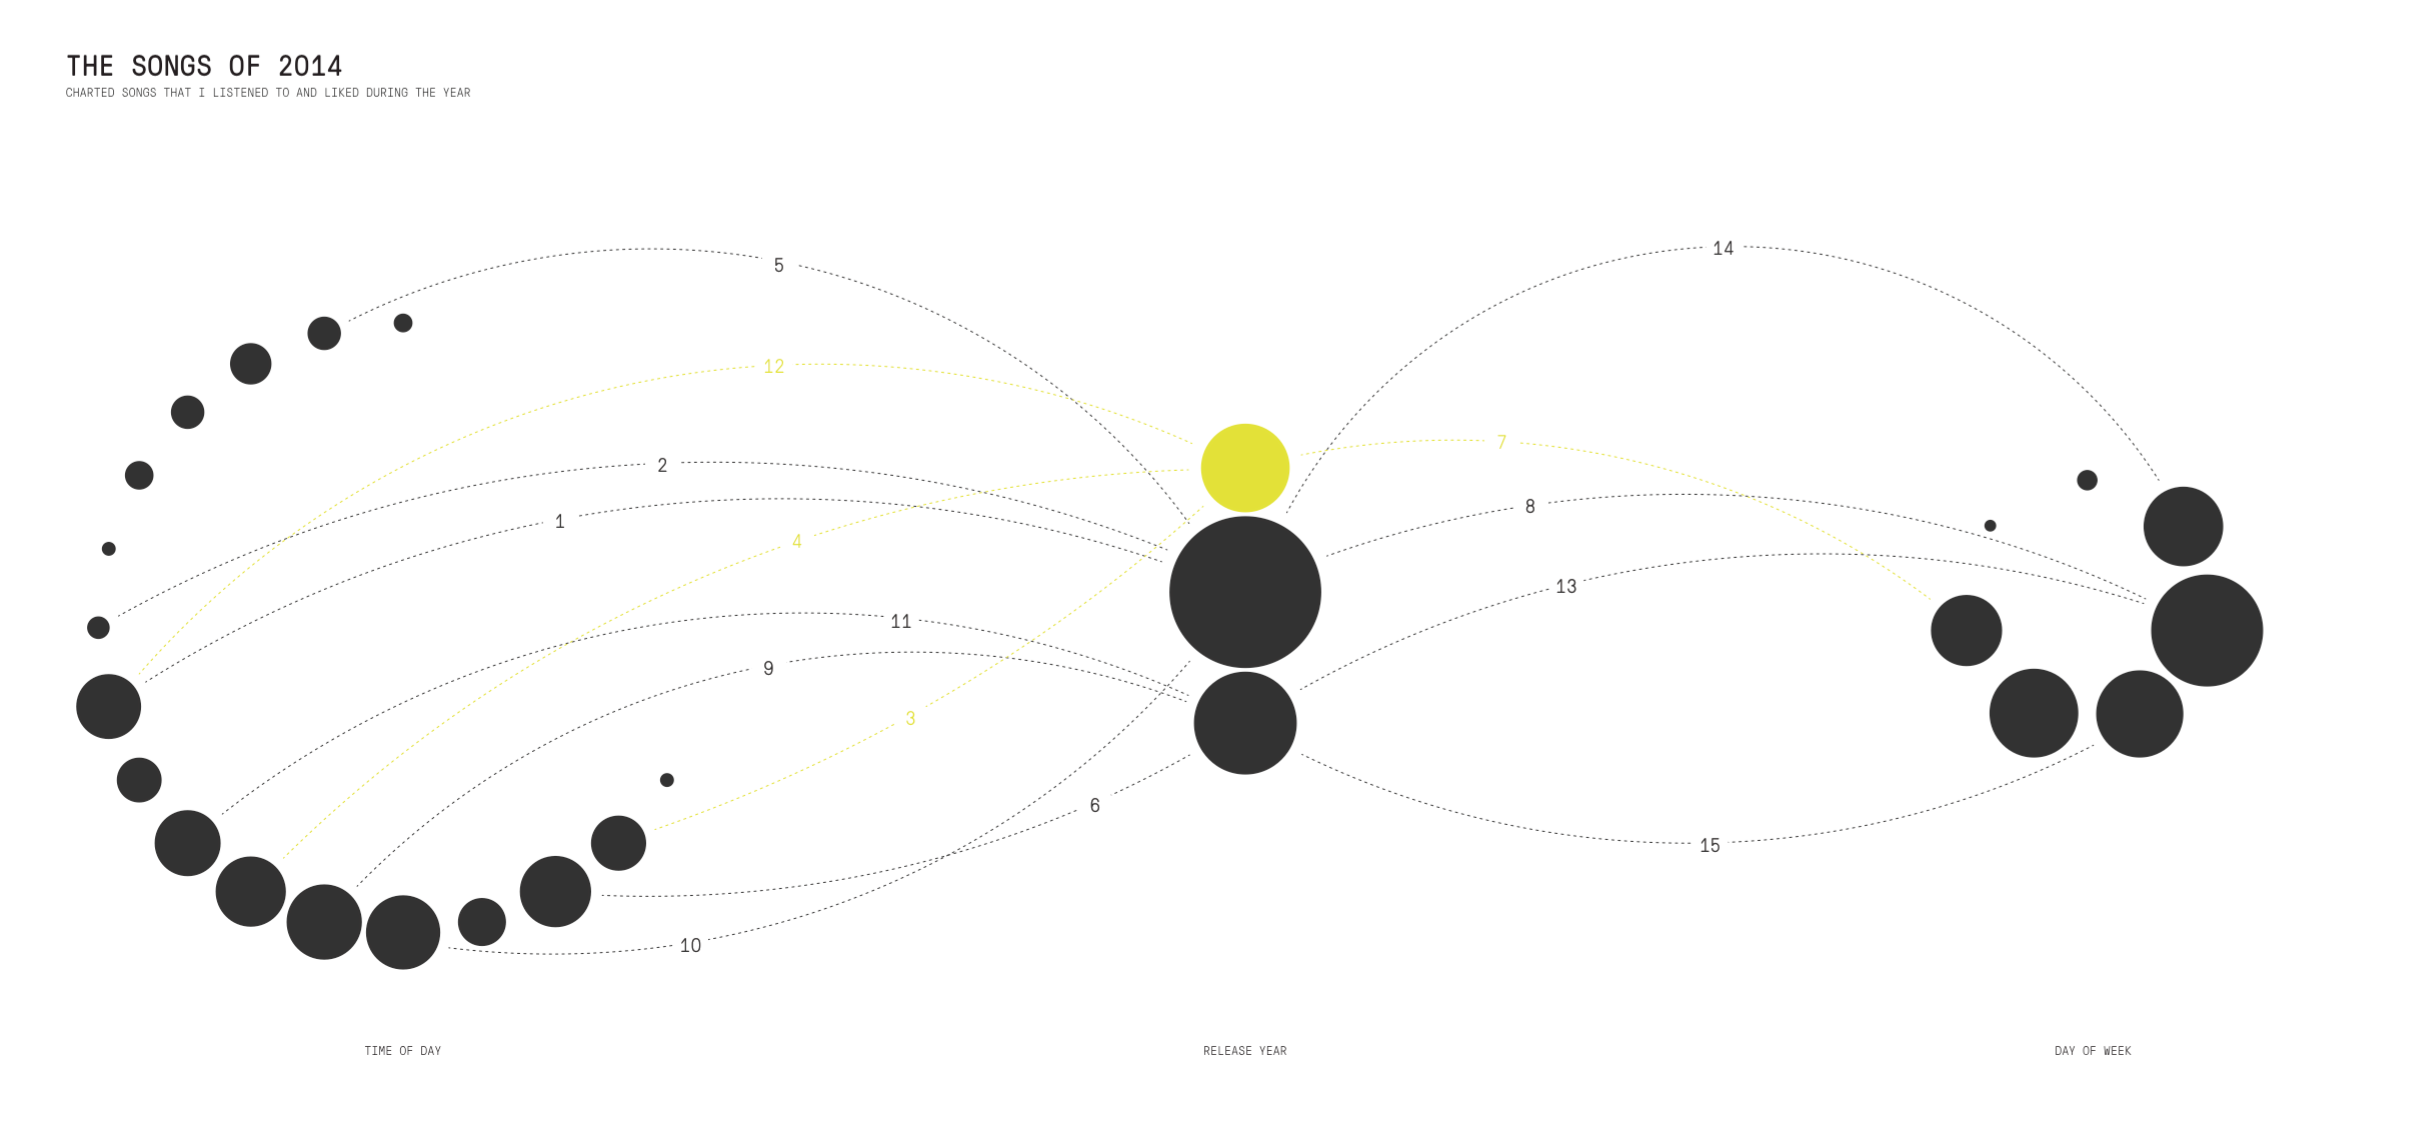
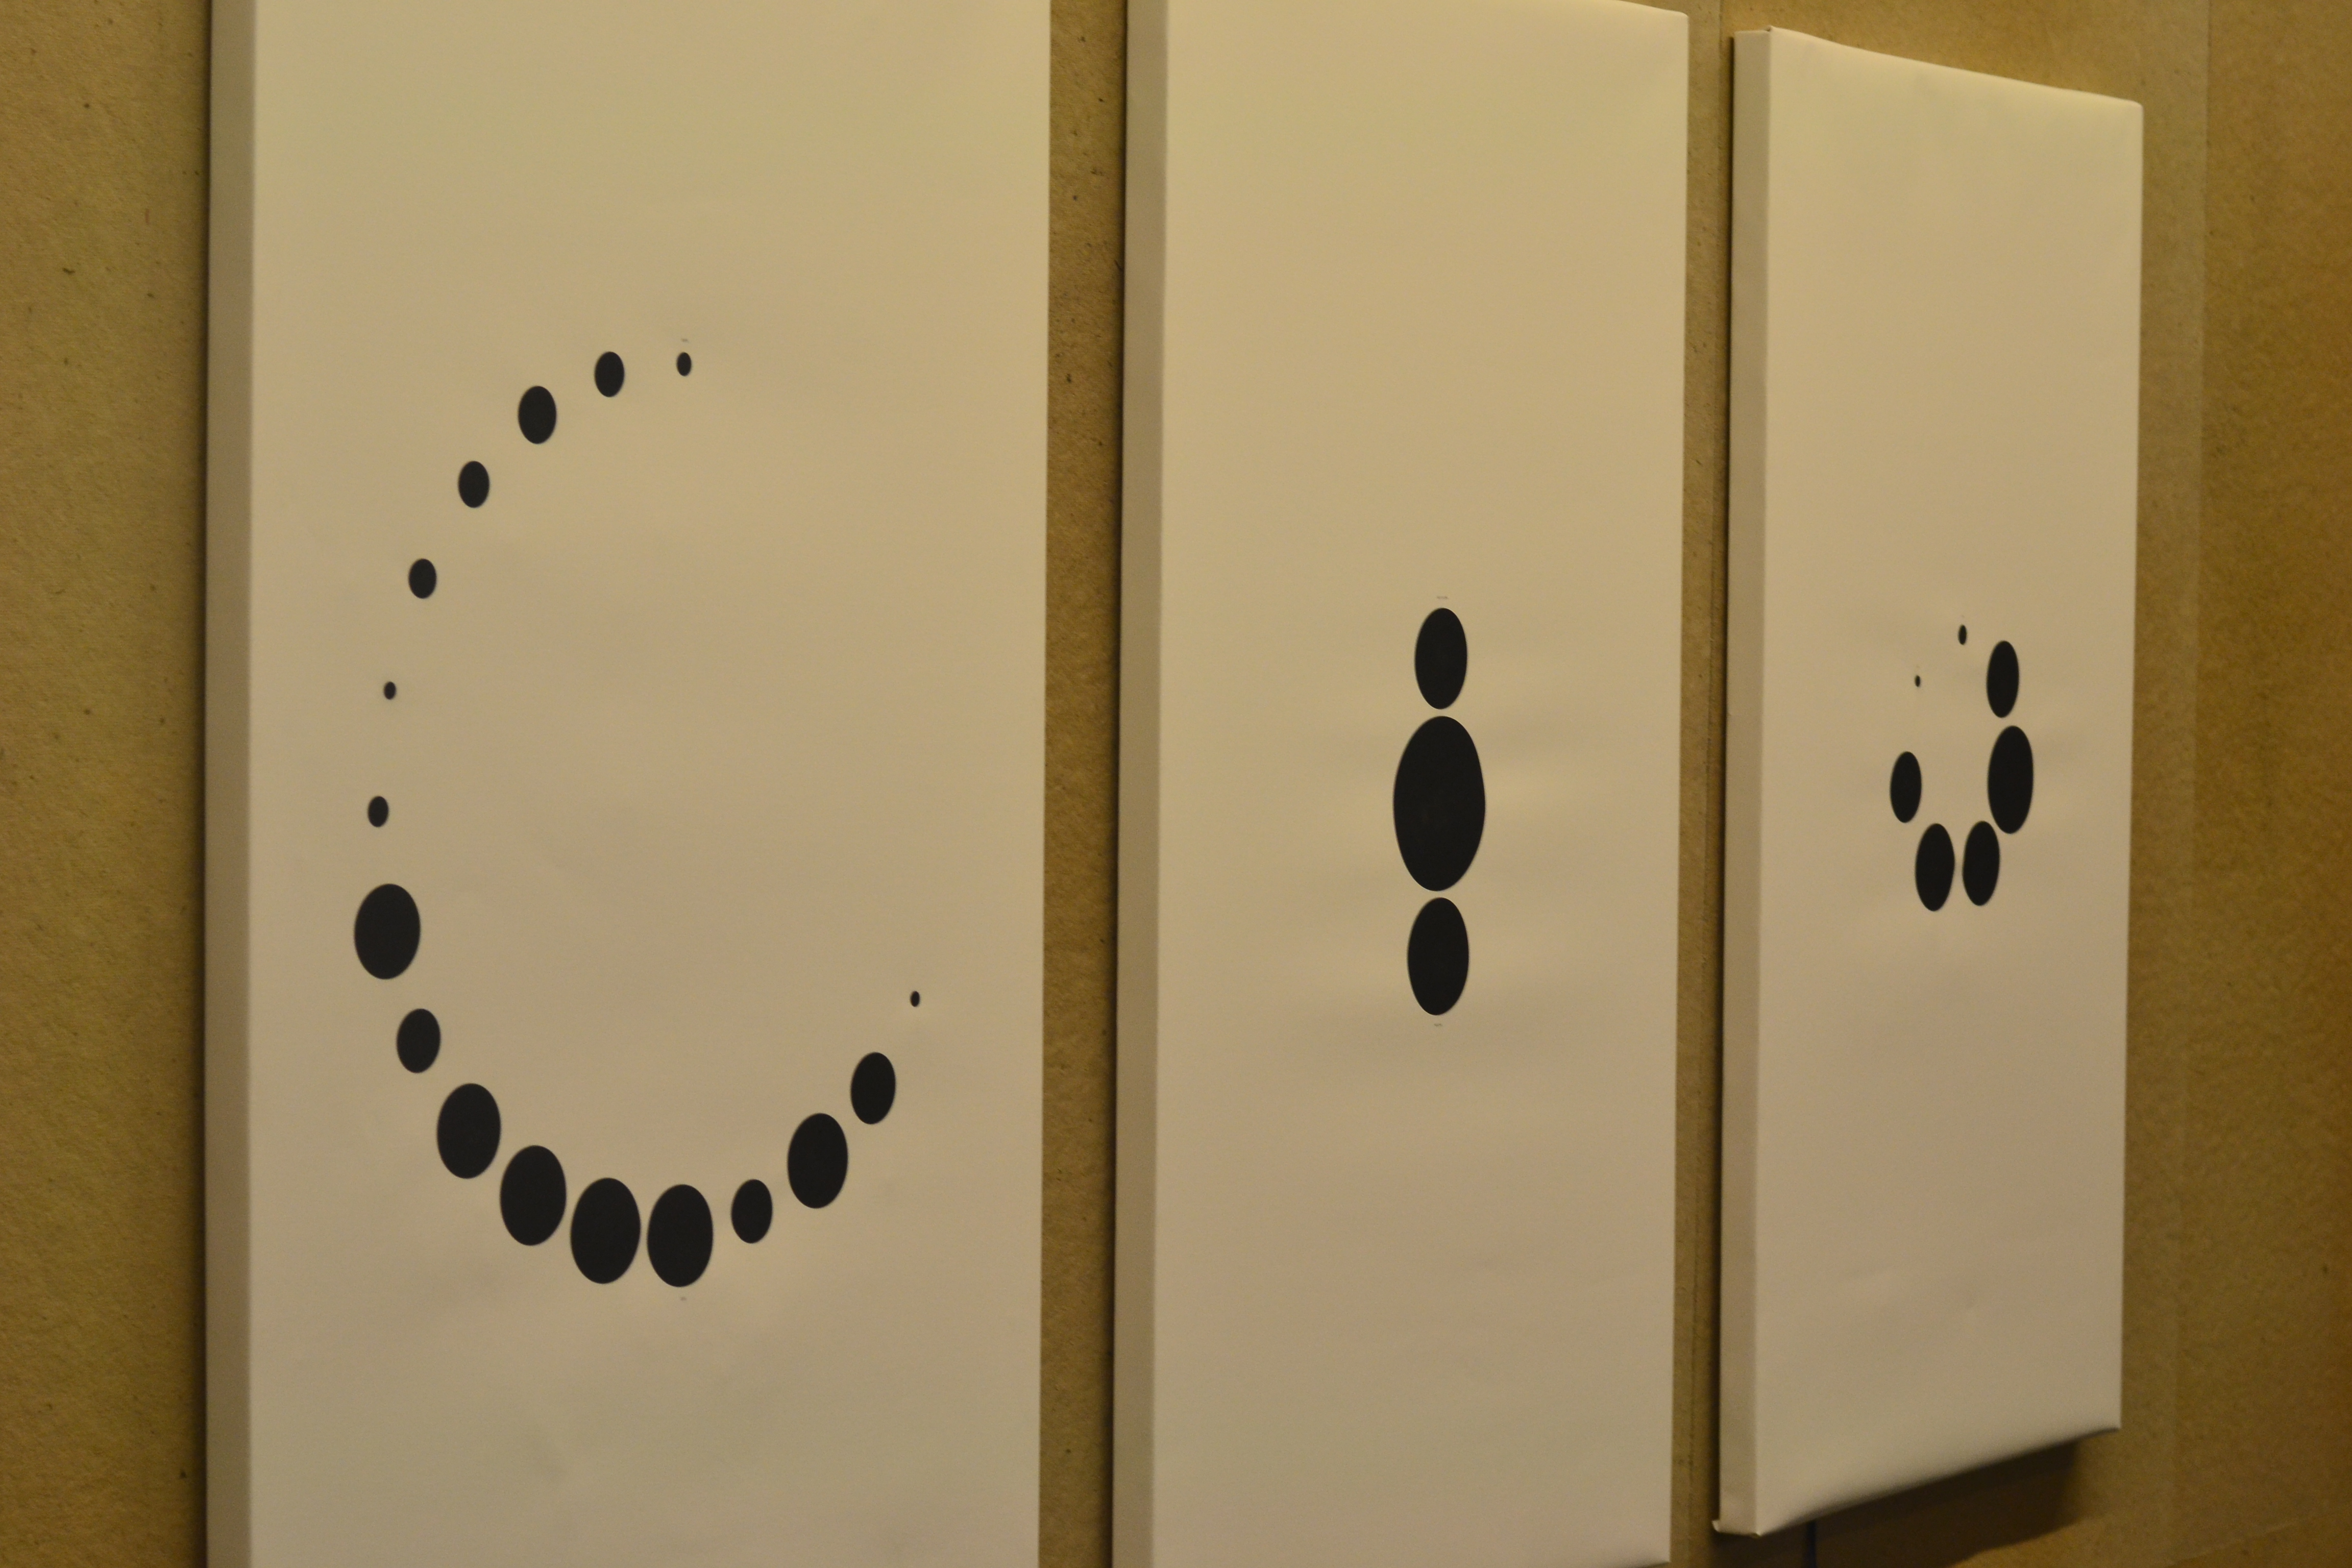
The three panels each represent a different dimension on a set of songs that were particularly influential on my life over the year. They ranged from new music I had never heard before to old classics that reemerged to songs I just couldn’t get out of my head. Each panel stands alone as a visualization of each dimension: Time of Day of Discovery, Year of Song Recording, Day of Week of Discovery. The visualizations show that I am most active in the afternoons, on Tuesdays, and with new music.
On display at frog design in Austin, TX for 4 weeks.
See a short video of it in action.
Read more about it on Medium.
Details:
Canvas hand stretched over wood frame
Hand painted with conductive ink